An excavator is enormously bigger and stronger than a piece of dental floss; yet an excavator can’t remove food particles stuck in your teeth the way floss can.
The usefulness of a tool depends on the context and environment in which it is used.
And that is why I built an API observability tool to be useful in my context and production environment.
Sure, it may not be as comprehensive, sophisticated, or well thought out as other API monitoring tools on the market.
But it is useful because I don’t have to:
- Pay for unnecessary complexity
- Force-fit my workflow into a product’s design
I designed a better way to floss daily, not compete with excavators.
You depend on Third-party APIs, but have no visibility
Let me unpack the problem for you.
Every day, my team of software developers rewrites, modifies, and adds to our codebase. And we use several third-party APIs.
So every payment workflow, LLM API, Google API, and microservice that we use increases the number of external API endpoints our product depends upon.
As a result, I’m constantly firefighting API risks.
I’ve had external APIs that worked in staging return an HTTP 401 Unauthorized error in the production environment after a few weeks, because an API key expired.
For instance, an SMS service provider’s API we used for many years suddenly started returning 401 Unauthorized errors. We noticed this only after a full working day. On further investigation, we learned that the API now had a different endpoint and JSON structure. To their credit, our vendor gave us a few days’ notice to make the required changes. However, the vendor’s notification was buried among the hundreds of unopened emails.
Similarly, I’ve had external APIs return a 422 Unprocessable Content error because we missed a deadline to update an API endpoint.
I’ve gotten HTTP 413 Content Too Large or 408 Request Timeout errors because an AI-generated query worked fine in low-traffic tests, but choked under the load of hundreds of concurrent users.
For instance, our automated hiring platform worked well until we served thousands of job-seeking candidates. But we ran into severe limits the moment we scaled operations to a million candidates. The average response time of our search API went up from 200 milliseconds to 15 seconds. In turn, this clogged up 95% of our MySQL server’s compute usage. Catching this API response spike early could have saved us a lot of headaches.
And I’ve also had an instance when our product leaked sensitive data because we were using an unauthenticated endpoint (that nobody remembers using).
Manually Monitoring APIs No Longer Works
Sneaky API errors are becoming even more unmanageable because:
- Usage of external APIs, shared libraries, and external codebases is increasing
- Many developers are working on the same codebase at the same time
- Code reviews and testing can’t keep up with the pace of AI-generated code
- The use of microservices creates even more moving parts
In such a scenario, it is mandatory to monitor API health. But manually looking into the logs to detect API errors is like looking for a needle in a haystack.

Fancy looking through 2,147 lines of logs to find the root cause behind an API error? No thanks.
Catching API Errors Automatically
My main motivation for creating an automated API monitoring tool was to stop relying on willpower to manually identify API risks.
As shown below, the tool automatically captures a log of all your production environment APIs and converts it into a spreadsheet.

Once you upload this Spreadsheet file by clicking the Import Data tab, the tool automatically checks every endpoint against the following three rules.
- Does the API require authentication?
- Does the API path expose sensitive data, such as a password or a token, in the URL?
- Is the API a duplicate of an existing endpoint?

The file format (spreadsheet for now) is not the important part. What matters is the shape of the data, endpoints, and their usage. So the spreadsheet can later be replaced by something smarter, say, an agent that watches real traffic and pushes data automatically, without changing anything else.
In my tool, I tag all external APIs in a list.
EXTERNAL_PROVIDERS = ["payments", "google", "firebase"]
Next, I define the API failure time interval. For instance, the code snippet below shows all the endpoints tagged in the tool that have at least one error in the last 7 days.
def get_external_api_failures(db: Session, days: int = 7) -> list[dict]: start_date = date.today() - timedelta(days=days) rows = ( db.query(UsageDailySummary, Endpoint) .join(Endpoint, Endpoint.id == UsageDailySummary.endpoint_id) .filter( UsageDailySummary.usage_date >= start_date, UsageDailySummary.error_count > 0, ) .order_by(UsageDailySummary.usage_date.desc()) .all() )
The tool then pushes the results that include the API endpoint ID, its path, method, provider, usage date, error count, and number of total calls into a spreadsheet:
    results = []
    for usage, endpoint in rows:
        tags_lower = [t.lower() for t in (endpoint.tags or [])]
        provider = next((p for p in EXTERNAL_PROVIDERS if p in tags_lower), None)
        if provider is None:
            continue  # not tagged as an external provider, skip

        results.append({
            "endpoint_id": endpoint.id,
            "path": endpoint.path,
            "method": endpoint.method.value,
            "provider": provider,
            "usage_date": usage.usage_date,
            "error_count": usage.error_count,
            "total_calls": usage.total_calls,
        })

        return results
In addition, my tool also detects any data leaks via APIs by defining all possible sensitive data records.
SENSITIVE_KEYWORDS = ["password", "token", "ssn", "apikey", "api_key", "secret"]
The tool checks each endpoint_id against predefined rules.
When it finds a rule match, it inserts that API endpoint and related details into a new ‘SecurityFinding’ row.
And yes, it does not enter duplicate results.
for endpoint_id in endpoint_ids: endpoint = db.query(Endpoint).filter(Endpoint.id == endpoint_id).first() if endpoint is None: continue
For instance, the following source code snippet shows how the tool checks an API for authentication errors.
    # Rule 1: no authentication configured
    if endpoint.expected_auth_type == AuthTypeEnum.none:
        _create_finding_if_missing(
            db, endpoint_id, IssueTypeEnum.no_auth, SeverityEnum.high,
            "Endpoint has no authentication configured (auto-detected on import).",
        )
Similarly, the following source code snippet shows how the tool prevents APIs from inadvertently exposing sensitive data via its URL.
    # Rule 2: path contains a sensitive-looking keyword
    path_lower = endpoint.path.lower()
      if any(keyword in path_lower for keyword in SENSITIVE_KEYWORDS):
        _create_finding_if_missing(
            db, endpoint_id, IssueTypeEnum.sensitive_data_in_url, SeverityEnum.high,
            "Endpoint path may expose sensitive data directly in the URL",
        )
These rules are only a starting point and are not yet a comprehensive set. Eventually, I plan to write rules for all the OWASP API Security Top 10 2023 patterns.
Monitoring APIs From A Single Interface
Monitoring all your APIs from the Overview page offers several advantages.
For instance, the tool tracks how many APIs are active and how many are at risk. It also categorizes all APIs into high, medium, and low risks. And it recommends action steps for all the APIs at risk.

The Usage page sorts API endpoints by traffic. This feature allows you to prune, modify, or delete inactive and at-risk APIs.

The Security page lists all your API risks by severity, endpoint, action taken, or current status. This gives you full control over all your APIs.
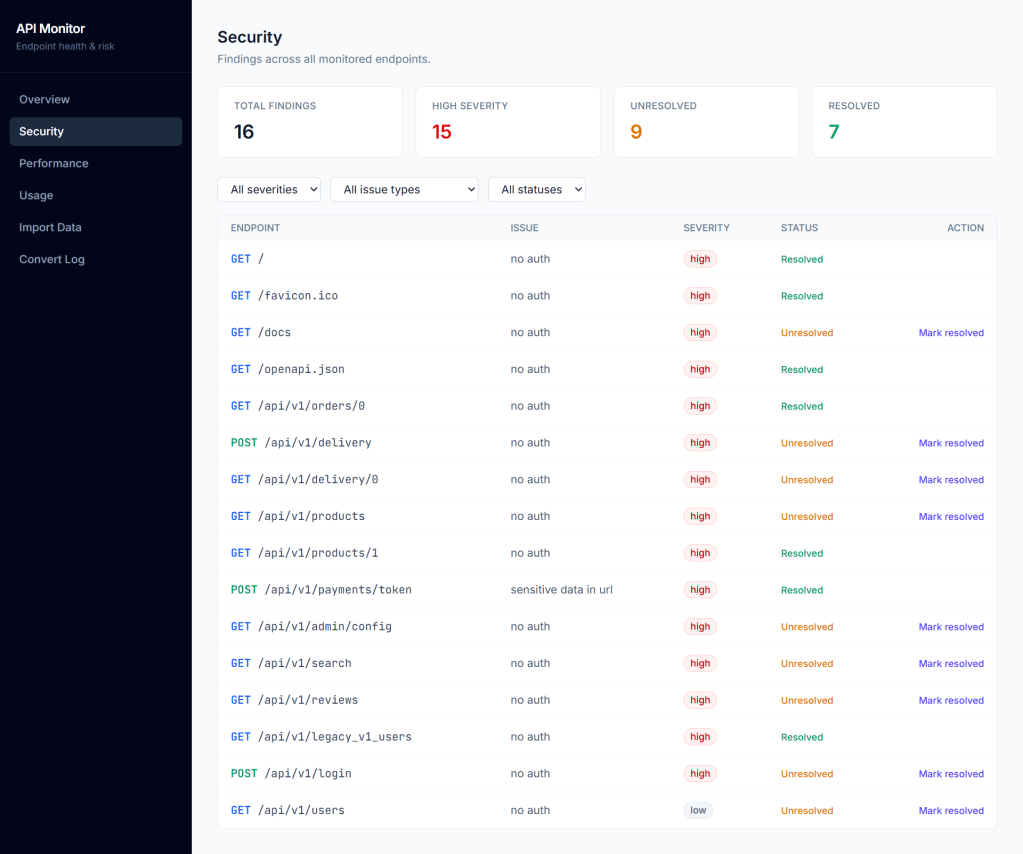
Alternatively, the Performance page provides a breakdown of average response time and total bandwidth usage for each API endpoint. This feature allows you to prioritize fixing either the most-used or bandwidth-consuming APIs.

API Monitoring, Like Flossing, Is Personal
Monitoring your APIs, like flossing your teeth, is personal. I’ve described an approach that feels intuitive and natural for my team.
Eventually, I plan to evolve this tool to dynamically check for API risks that don’t have pre-defined patterns. To achieve that, I’d have to create an AI agent that studies API usage patterns for anomalies and takes necessary actions. Do write to me if this interests you.
For now, you can download the source code, customize it for your needs, and contribute your time to improve it. I’ve named this tool VizhiOps.
Note: I ghostwrote this piece for Lochana, the head of technology at a startup that automates the hiring process for MNCs. I dug into her story and GitHub source code to present this tool to other engineering leaders. It will soon be published on her blog and LinkedIn profile.

