Context: I managed Acceldata’s account at Animalz.co during the 14 months they used our services. Initially, we began with basic posts such as “What is data observability?” and “Why you need to focus on data quality?” But we weren’t getting engagement from our target audience of data engineers.
About four months in, we ditched the SEO approach to address a key pain point of our target audience. We learnt that most of our audience had at least some production in a Snowflake environment, and they were all concerned about unpredictable escalating costs. So, we wrote about how Acceldata helps engineers optimize their Snowflake environment. To showcase our user-friendly GUI platform, I compare it with manual queries.
Note: This article was ghost-written for Acceldata as part of my consulting services with Animalz to be published on Acceldata’s blog.
Snowflake’s pay-per-usage pricing model can act as a double-edged sword. If you’re not careful, oversights can quickly escalate Snowflake costs, which may come back to bite you in higher cloud bills.
Our data observability platform will safeguard you from unpredictable Snowflake environment costs by generating the following eight reports.
1. Monitor Costs Across All Your Snowflake Services
Get daily or monthly aggregated Snowflake cost trends automatically as a stacked bar graph. Each Snowflake service, such as compute, storage, clustering, and Snowpipe, is represented in different colors.

Get daily or monthly aggregated cost trends automatically for all your Snowflake services in the form of a stacked bar graph.
Hovering over a bar shows you a breakdown of costs across all your Snowflake services for the selected time period. For example, from this dashboard, you can see how much each Snowflake service has cost over the past 12 months.

Acceldata automatically calculates costs for each Snowflake service. Hover over a month to see a monthly cost breakdown of each Snowflake service.
This dashboard will help you monitor your overall Snowflake costs and avoid budget underutilization or overutilization.
To get a monthly cost breakdown without Acceldata, you’ll need to run a manual query similar to the below code that Snowflake Solution Architect John Ryan suggests in his blog post.
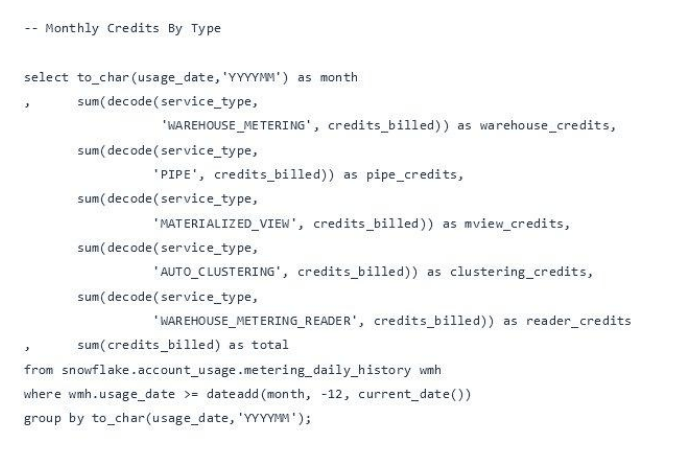
Without Acceldata, you’ll need to run a manual query as shown above to see monthly credits used by each Snowflake service. Source
However, please note that every time you change your Snowflake infrastructure or services, you’ll need to update these manual queries accordingly. Otherwise, your results may have errors.
Also, by monitoring Snowflake costs manually, you may lose opportunities to proactively align usage and costs.
2. Automatically Identify Cost Anomalies That Spike Your Bills
Acceldata automatically understands your average compute resource usage boundaries and flags any workload spikes that fall outside them. By alerting you to cost anomalies as and when they occur, Acceldata helps you avoid unnecessary spikes in your monthly Snowflake bills.

Acceldata’s Compute Observability features automatically detect cost anomalies that fall beyond your estimated average daily cost.
Without Acceldata, there is no straightforward way to query Snowflake for cost anomalies as and when they occur.
The closest workaround is to use Snowflake’s resource monitor notifications. To use this feature, you’ll need to manually enter threshold limits for each resource and set what action needs to be performed after exceeding a threshold. You can choose between the following three actions:
1. Send notification and suspend activity after the queries are completed
2. Send notification and immediately cancel the running queries and assigned warehouses
3. Send notification only without any additional action
Snowflake allows you to send email notifications to all admin accounts, that have enabled their ‘receive notifications’ preference setting.
However, this workaround’s limitation is that manually set resource limits don’t consider how much your Snowflake environment has scaled. So, you’ll need to constantly update these limits to avoid resource constraints.
3. Get a Granular Overview of Your Compute Resource Costs
The Acceldata dashboard also lets you filter costs incurred for each Snowflake service. For example, you can filter out the storage and clustering costs to view only the compute costs over the last 30 days. Such a view helps single out cost overruns or underruns for specific Snowflake services.
Switching the time period from daily to monthly shows you Snowflake service costs for the past 12 months.

Filter each Snowflake service cost to identify under-budgeted or over-budgeted services and view cost trends as a daily or monthly view.
Without Acceldata, you’ll need to run individual queries to get a monthly or daily cost overview for each service. Because Snowflake treats compute resources as virtual warehouse credits, you’ll run a query similar to what John Ryan suggests in his blog post.
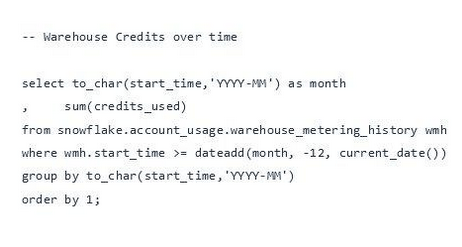
Without Acceldata, you’ll need to manually run a similar query to get the breakdown of your monthly Snowflake compute resources. Source
You’ll also need to run similar queries to extract costs of other Snowflake services such as storage, clustering, or Snowpipe.
4. Identify Which Storage Repositories Cost You the Most
Within Acceldata’s storage dashboard, you can view your monthly Snowflake storage repository costs. Set the time interval to view storage costs over the last week, month, or year. This dashboard automatically summarizes storage costs for the current month and the previous month. It also shows you the average monthly storage cost as a baseline comparison. You can use this information to understand how your monthly costs vary.

Drill down your monthly Snowflake bill into granular views that show which databases or data tables cost you the most.
The Acceldata dashboard also allows you to drill down your storage costs into the top five costliest databases, data tables, and churn tables. This can help you investigate ways to reduce your storage costs further. For example, you may be able to use this information to identify a costly database with little or no utility.
Without Acceldata metrics, you must run individual queries to extract current and previous month storage costs. To get an average monthly cost baseline, you must extract storage costs over the previous 12 months and calculate their average value.
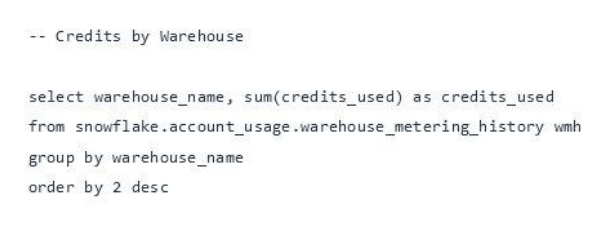
Without Acceldata metrics, you can still get an ordered list of storage credits grouped by each data warehouse. But to do that, you would need to run a query similar to John Ryan’s suggestion.
And to get an ordered list of storage credits by users, you’ll need to run a query similar to:
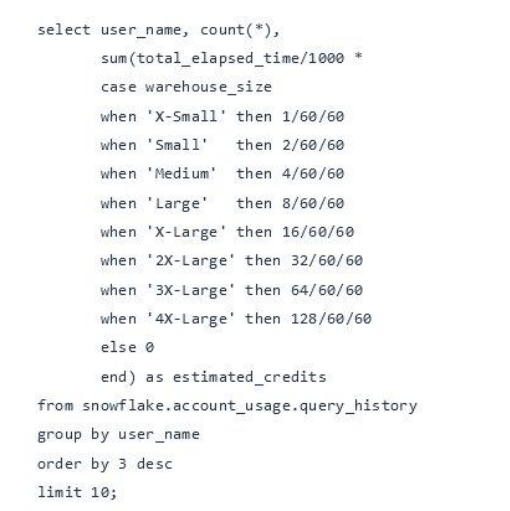
Without Acceldata, to get an ordered list of storage credits, you’ll need to run a query similar to the above image. Source
However, these manual queries only show results for a particular time instance; they don’t help you see the pattern over a period of time. So, if you want to proactively identify potential storage cost areas, you’ll need to run these queries on a periodic basis and decipher your usage patterns.
5. Investigate Timeouts That Drain Compute Resources
Acceldata automatically flags unexpected workload spikes that cause timeouts in your Snowflake environment. Acceldata Guard Rails provides a list of users, queries, warehouses, or errors that triggered a Snowflake timeout. The list narrows down problem areas, helps you investigate root causes faster, and reduces compute resource wastage.

Acceldata’s Guard Rails list narrows down your timeout problem areas and helps you investigate root cause problems faster.
Without Acceldata, when a Snowflake service timeout occurs, you must manually check the STATEMENT_TIMEOUT_IN_SECONDS parameter for the account that caused a timeout.

Without Acceldata, you need to check the STATEMENT_TIMEOUT_IN_SECONDS parameter to identify what caused a Snowflake timeout.
If you want the Snowflake service to continue, you must set a higher value for the timeout parameter. For example, you could set the new timeout parameter value to 180,000 seconds using the following command.
alter warehouse set STATEMENT_TIMEOUT_IN_SECONDS=180000;If you set this parameter too high, you risk running unnecessary workloads that can quickly consume your computing resources and result in a hefty bill. If you set the timeout too low, you risk interrupting necessary workloads.
6. Get All Admin-level Insights in One Place
Acceldata’s admin dashboard shows you admin-level configuration data for your Snowflake environment. Its interactive charts can help you visualize user roles, dormant users, and recent user password changes.

The Acceldata dashboard shows all the information you need from a single user interface view.
The admin dashboard can also help you further categorize login activities by user IP address, client type, and failed logins. This helps you weed out suspicious activity, and, where needed, it also helps you reach out to users with the right support.

Without Acceldata, there’s no straightforward way to get such admin-level insights beyond the set of basic Snowflake features. As a result, you risk remaining unaware of such user-level changes, which may in turn, affect security, performance, or both.
7. Predict Resource Utilization Before You Get the Bill
Acceldata’s capacity planning feature helps you predict resource consumption across all your Snowflake accounts and services. It helps you identify under or over-utilized services. And it can help you get more value from your annual contract.

Acceldata’s contract capacity planning feature predicts your cloud resource consumption against your contract capacity.
The contract dashboard summarizes key contract information, such as the total value of services consumed at present, as a percentage value of the total credits and a dollar-cost value. It also shows how many months are left until you renew your annual Snowflake contract.
In addition to these basic data points, Acceldata also shows a contract prediction chart. This chart extrapolates your usage patterns to predict how many credits you may use by the end of your contract period. Instead of learning about resource utilization after the bill is generated, use this chart to identify cost overruns or underruns before you get the bill.
In the example shown above, without Acceldata, the company will find it hard to use manual queries to gain this level of understanding. Manual queries alone can’t show that they’re setting themselves up to only use 35% of their contract capacity. Based on their current usage data, manual queries also can’t help them predict a potential waste of over $8,000 in unused compute resources.
8. Get Granular Insights On Your Queries
Acceldata goes beyond these basic features to categorize all your query execution times by warehouse name, warehouse size, and database. It can also show you a historical view of your query execution times.

Acceldata automatically categorizes all your query execution times with respect to warehouse name, warehouse size and database
This dashboard can also help you get a list of the top five longest-running and resource-expensive queries for a selected time interval.


You can also get average query times categorized by each data warehouse and database.

Every Snowflake query you run puts a toll on resources. The Snowflake platform allows you to check the basic performance of a particular query. In this blog, Pinal Dave shows us how to analyze query performance in Snowflake.

Snowflake’s history offers more details about a query.
Clicking on the query profile tab will show you more details about query performance. It includes details such as execution time, IO bytes scanned, and pruning partitions scanned.
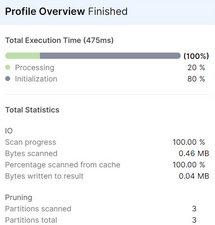
Get further query performance details by clicking the profile tab of a particular query.
But this still doesn’t offer a straightforward way to dissect your query performance and compare them with other query performances. Without knowing which queries cost you how many resources, you can’t optimize the Snowflake queries.
With Acceldata’s query performance charts, you can identify resource-hungry queries and find ways to optimize them further.
Get Data Observability Compute Metrics for Snowflake Within Minutes
Acceldata gives you more control over your Snowflake environment. It can help you predict costs, improve performance and optimize the value you get out of the annual contract.
But more importantly, you can set up Acceldata metrics within a few minutes. Get all these rich, dynamically updated metrics in less time than it takes to write and test a single manual query.
To get started, specify the Snowflake URL used to locate the database schema and the right username, password, user role, and analytics pipeline you want to connect to.
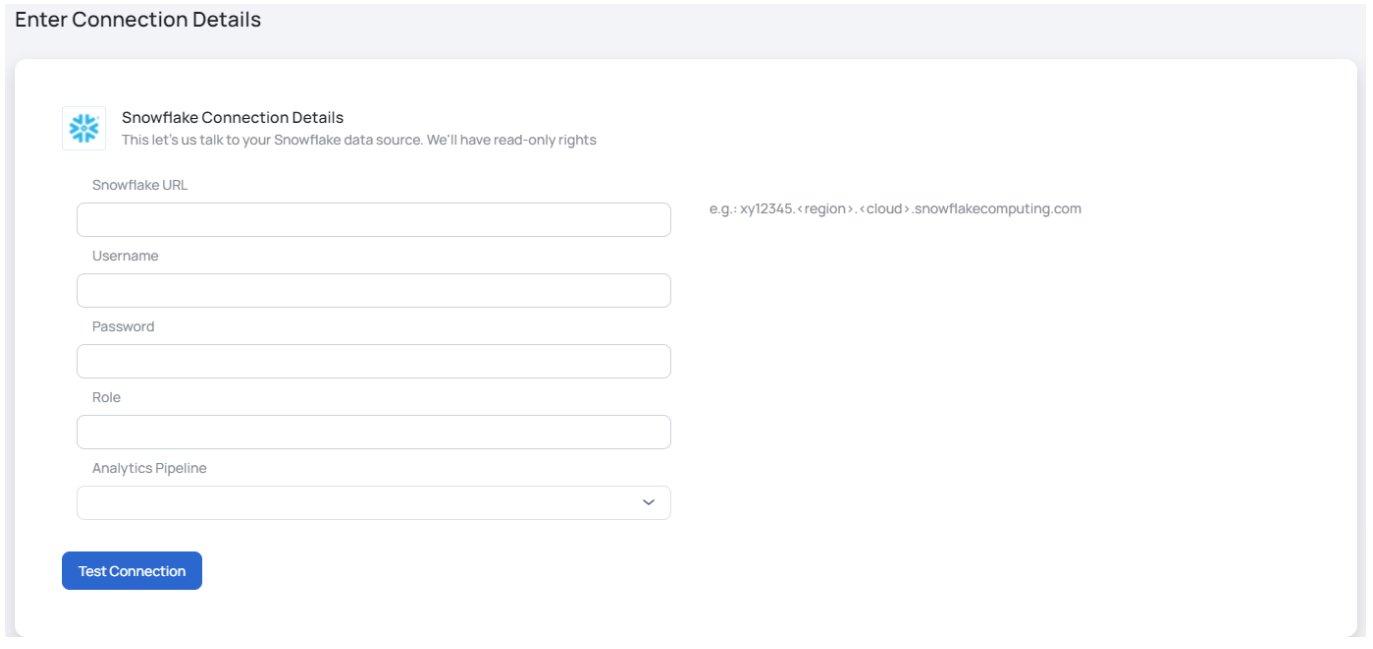
After connecting to your analytics pipeline, select a Warehouse from the drop-down list, and depending on your contract costs, enter the applicable cost per credit.

You’ve now successfully set up Acceldata metrics for your Snowflake environment. Acceldata’s capabilities go far beyond the eight metrics shown in this article. Sign up for a free personalized demo, and explore all the other features that Acceldata has to offer.
Note: This article was ghost-written for Acceldata as part of my consulting services with Animalz and was published on Acceldata’s blog.
